Documentation
1. Overview
Jet Profiler for MySQL is a query profiling tool for the MySQL database server. Core features:
Query, table and user performance
Jet Profiler focuses on queries, tables and users. This gives you the information you need most in order to quickly fix performance problems in your code, such as most frequent queries, most used tables or busiest users.
Graphical visualisation
Data is collected, analyzed and displayed in real-time in diagrams, pie charts and tables. You can easily drill down and navigate through the data.
Low overhead
Most of the profiling work is done in the Jet Profiler application, not in the database server. Therefore, the performance hit is normally negligible, around 1%.
Easy to use
It supports all MySQL versions. No database server changes are necessary. No agents or separate services are needed. Jet Profiler is a desktop application which runs on your computer. You start it, connect to a server, hit the record button, and see results within minutes. And it runs on Windows, Mac and Linux.
2. How it works
Jet Profiler is a desktop application that runs on your computer. When you start to record performance information, the application will connect to a specified MySQL server. It will then collect different performance metrics from the server every second (or 100ms - 10s, configurable). This information is then stored and analyzed in an internal database in the application.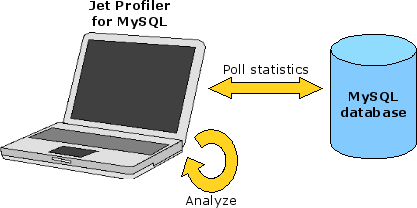
The collected information is presented in a GUI where you can drill down on different aspects. You can view the trends (such as how many queries are executing) and zoom in on peaks in the load, and you can view top lists for different time frames (such as the most seen queries). The information is available close to realtime, giving you instant feedback on performance variations. This makes it very easy and efficient to optimize your database. For instance, you can add indexes on the fly and watch the difference within seconds.
MySQL commands
By knowing the underlying commands that are run, we hope you can make more use of Jet Profiler for MySQL, and better understand the information that is presented. The performance metrics are gathered using the commands SHOW PROCESSLIST, SHOW OPEN TABLES and SHOW GLOBAL STATUS. An explanation on what information is given from each command is explained below.
SHOW PROCESSLIST
This command shows a snapshot of the threads in MySQL. A thread is a user connection, so the list shows all connected users (and some internal MySQL threads, such as replication threads). For every thread, the following information is shown:
- Username
- Source ip / port
- (default) Database (schema)
- Command (such as querying, sleeping) – this can reveal which threads are actually doing something, and which are idle.
- Query – The query being run.
- Time – How many seconds the query has run.
- State (such as updating, locked, writing tmp table to disk) – this can reveal what subtask a query is in
This is where Jet Profiler for MySQL gets most of its information. By watching changes in the processlist, it can determine which users are consuming most number of threads and what queries are run the most (in terms of time). It can observe the state and determine if a query is lock prone or not, or if it is creating a lot of temporary tables on disk. It can also keep track of queries that take long time to run, and mark them as slow queries. For more information on SHOW PROCESSLIST, See:
http://dev.mysql.com/doc/refman/5.1/en/show-processlist.html
SHOW OPEN TABLES
This command shows which tables are being used in the database. Every query that needs to access a table will increase the open count for the table. For every JOIN, an open count increases by one, so a query which uses a table multiple times through JOINS, it will give multiple open counts. This gives an overview of which tables are being used the most. Note that the information is not weighted; if a query is using two tables, this information will not show if the majority of resources are spent in the first or the second table. For more information on SHOW OPEN TABLES, see:
http://dev.mysql.com/doc/refman/5.1/en/show-open-tables.html
SHOW GLOBAL STATUS
This shows lots of different metrics on a global level for the database, such as number of connected users, network i/o statistics, innodb statistics, handler statistics etc. For more information on SHOW GLOBAL STATUS, see:
http://dev.mysql.com/doc/refman/5.1/en/show-status.html
The Thread count
Since Jet Profiler for MySQL is based on the SHOW PROCESSLIST command above, most load figures are presented as ”Threads”, meaning average number of threads busy with a query or number of busy threads for a user. Depending on the tasks the query is performing in the underlying database, the thread can be consuming CPU or disk resources, or it could be waiting for internal locks before it can safely continue with its query.
A simplification is to say that a thread count of 1 means 100% load, especially if the load is mainly disk-bound. If the load is mainly cpu-bound, the max capacity is rougly the number of cores. E.g. a 4-way machine can handle thread counts of 4 before reaching 100%. Jet Profiler cannot distinguish between disk and cpu load per thread, so you will have to study metrics of your database in order to determine what thread count is equivalent to 100% load.
During congestion, you might see thread counts of 10 (or higher), since many threads will compete simultaneously for the same resources. In such situations, the thread count best used as a relative measure, such as user A is 5 times heavier than user B.
Stored queries
Jet Profiler stores the queries it sees in the processlist in two forms, normalized queries and example queries.
Normalized queries
When a query is normalized, all literals (strings, numbers, dates etc) are replaced with ?. For instance:
SELECT * FROM table WHERE id = 123
will be normalized to
SELECT * FROM table WHERE id = ?
Normalization is necessary in order to aggregate statistics about queries. When you look at the Top queries top list, it will be based on the normalized form.
Example queries
The downside of a normalized query is that it cannot be executed or explained. For this, you need real parameter values. Therefore, for every normalized query stored, Jet Profiler will store the slowest query in its original form, called an example query. It will also store all slow queries in its original form.
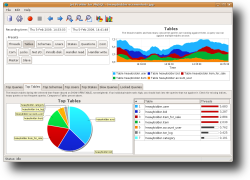
3. The screen
This section describes the various parts of the screen. The screen consists of:
- Toolbar - buttons to edit various settings and scroll and zoom the line chart
- Preset buttons – data to show in the line chart
- Line chart – zoomable chart showing different metrics
- Top list tabs – different top lists showing heaviest queries, heavies tables and more
- Status bar – a status bar at the bottom which shows the status of the application
The toolbar
The toolbar buttons are:
- Edit connection settings (see below)
- Edit recording settings (see below)
- Record button – This button starts recording information from MySQL.
- Stop button – This button stops recording information from MySQL.
- Line chart scroll left
- Line chart scroll right
- Line chart zoom in
- Line chart zoom out
- Line chart show all
- Change chart type – This button toggles between line chart and area chart, and changes the appearance of the line chart.
- Line chart settings – This button opens up the Line chart settings dialog. Here you can choose what items to display in the line chart, in addition to the preset buttons. You can also adjust the smoothness of the chart. Smoothing will remove details which makes it easier to spot trends. This can be useful if the data is noisy or edgy.
Edit connection settings
This allows you to specify how to connect to the MySQL database. A dialog allows you to enter server host name / ip, port, username and password. A Test Connection button allows you to verify that the information is correct. It will try to connect and also verify the users rights, since certain grants are needed to be able to get enough profiling information. The grants needed for the user are:
GRANT USAGE, SELECT, PROCESS, SHOW VIEW ON *.* TO jetprofiler@'%' IDENTIFIED BY 'password'
You can either use the root account, or create a separate account for this purpose. As always, be sure to restrict the host and set a secure password.
You can connect via an SSH tunnel by entering the required information - ssh host, port, username and authentication method. Choose between password- or key-based ssh2 authentication.
NOTE: If you are unable to create an account with the required privileges you will not be able to perform complete profiling. For instance, most big web hosting companies will probably not give you this. If you do not have the SELECT ON *.* privilege, you will not be able to see Top Tables or Top Schemas information for the whole database server. What you will see is for the schemas and tables you have SELECT rights. This means you will not have a complete picture of the table usage, but you can compare the figures relatively, e.g. which ones of your particular tables are most used. If you do not have the PROCESS ON *.* privilege, you will only be able to see queries, slow queries, locked queries and states belonging to your user account. Any queries run by a different user will be invisible to you. You can still compare your own queries against each other, but you cannot know their share of the whole server load. Most line chart information (such as Questions, Com_selects, temp tables, index usage, innodb hit rate etc) are global for the whole server and are not affected by insufficient rights.
You can store multiple connection settings as bookmarks in the left part of the dialog. The Add, Copy and Delete buttons allow you to add, copy and delete bookmarks.
The record button will start recording from the selected server.
Edit recording settings
In the recording settings dialog, you can adjust the polling interval. This controls how often Jet Profiler collects information from MySQL. On busy systems, you might choose the setting 1 second or higher (10 seconds), whereas on less loaded systems, you can choose very fine granularity (100 ms). The shorter the interval, the faster you will get profiling information back. Shorter intervals also means slightly higher database load, since the polling costs a few percent. (You can see how much it costs in the Cost preset, see below).
You can also adjust the slow query threshold. When a query takes longer than x seconds to complete, Jet Profiler will mark it as a slow query, and it will show up in a separate top list in the GUI. This can be a rough filter to single out the worst performing queries. A preset in the linechart will also show you how many slow queries are running. Note that the slow query time resolution is equal to a multiple of the polling interval, so a polling interval of 100ms can recognize queries taking 200, 300, 400, 500 ms etc. Time spent waiting for MyISAM locks (State Locked) is excluded from this time.
A reasonable default for these settings is to use a polling interval of 1 second and a slow query threshold of 2 seconds.
The data retention timeframe lets you specify how long Jet Profiler should keep the recorded data. As more data is gathered, the processing will take more time to complete, and more disk space will be used. By adjusting this value you will be able to run Jet Profiler for long periods of time without performance degradation or excessive disk usage.
Preset buttons
The upper half of the screen contains a series of preset buttons. These are sets of metrics that you can see in the line chart to the right. You can click on the buttons to change what metric you are looking at in the line chart. Much of the information in the presets are based on MySQL server status variables, see:
http://dev.mysql.com/doc/refman/5.1/en/server-status-variables.html
In addition to the presets, you can choose what data to display using the Line Chart Settings button in the toolbar. There you can choose from numerous additional metrics which are not covered by the presets. The presets are:
Threads
This is a basic performance metrics. Threads_running is number of running queries. Anything above 0 means the server is working. Slow_queries_running indicates how many of these are slow. Threads_connected is number of connections. This preset allows you to quickly see if the server is busy or not, and if there is any performance congestion or similar, as this will typically show as peaks in running threads or slow queries running.
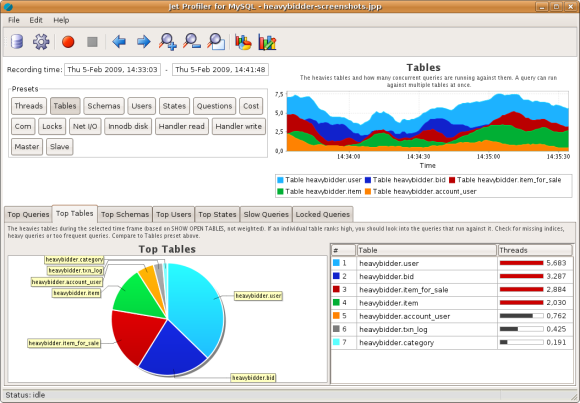
Tables
The heavies tables and how many concurrent queries are running against them. Note that a query can run against multiple tables at once, and a table can be used multiple times in the same query, as every JOIN counts as one. Here, you can watch trends between different tables, such as if a certain table is used more during a thread spike.
Schemas
The heaviest schemas and how many concurrent queries are running against them. This is similar to the Tables preset, except the information is aggregated on a per schema level.
Users
The heaviest users and how many concurrent queries they are running. This is especially useful in multi-user environments, when you need to quickly find which user might be causing a certain spike or congestion.
Ips
The heaviest client IPs and how many concurrent queries they are running. If you have many db clients with different usage patterns, this will be useful. For instance, you might run cron jobs from a certain web server node or have a dedicated web server for admin web site access.
States
The most frequent database states and how many threads are in each state. Some states are associated with increased disk load, such as writing tmp table on disk. Other state are associated with lock congestion, such as the Locked state. While on a lower level, this information can sometimes reveal interesting details about the load during a spike. For more information on MySQL states, see:
http://dev.mysql.com/doc/refman/5.1/en/thread-information.html
Cons
The biggest users of connections. While the Users preset above shows which users are most busy, this preset shows the users allocating the most connections. This can help you find applications which allocate a lot of idle connections, for instance due to oversized connection pools.
Cost
The cost for running Jet Profiler against the MySQL database. You can see both the total cost and the cost per profiling step. The measure is presented as a thread count, so you can compare the cost of running Jet Profiler to the cost of different queries in the Top Queries tab. Usually, you should see costs of around 1% for 1 second poll interval.
Questions
How many queries are performed per second. This is a rough measure on the throughput of the server. A sudden decrease might indicate a congestion, such as one or more heavy queries eating resources from normal, fast queries.
Com
How many SELECTs, INSERTs, UPDATEs etc are performed per second.
Locks
Shows how many threads are locked on average, vs connected threads. Locked threads are waiting on MyISAM table locks. This slows down performance and increases replication lag. See Locked queries tab and Profiling replication below.
Net
Network traffic in bytes. Big SELECTs can generate a lot of outbound traffic.
Handler read
Number of low level operations for reading data or indices. Every query translates to one or more handler read operations. Unindexed queries can cause a lot of random reads. For more information on handler operations, see the link above.
Handler write
Number of low level operations for writing data. Every INSERT (or other write query) translates to one or more handler write operations. For more information on handler operations, see the link above.
Scans
The percentage of data reads that were performed using table scans. Efficient reads are done using indices. When an index cannot be used for reading, table scans are performed. Try to stay below 20%.
QCache
The query cache caches results of SELECTs in order to reduce read load. The query cache hit rate is the percentage of queries which hit the query cache, the higher the better. To improve query cache hit rate, increase the cache size and review write queries which invalidate the query cache.
MyISAM cache
MyISAM uses a key buffer to cache indices. For MyISAM exclusive systems, allocate 25-40% of memory to the key buffer, so that as few index reads as possible hit the disk. You should be able to achieve a hit rate of 99%. The value shown is the percentage of index reads that used memory cache instead of going to disk. Increase key_buffer_size to improve hit rate.
Innodb cache
Innodb uses a buffer pool to cache indices and data. For Innodb exclusive systems, allocate about 90% of memory to the buffer pool, so that as few reads as possible hit the disk. You should see a high cache hit rate. The value shown is the percentage of innodb reads (index or data) that used memory cache instead of going to disk. Increase innodb_buffer_pool_size to improve hit rate.
Innodb disk
The disk i/o operations done by InnoDB tables in bytes. Data read/write correspond to table content and indices. The log is used for transaction handling and recovery.
Temp tables
MySQL creates temporary tables when doing some GROUP BY, ORDER BY, DISTINCT, UNION and subselects, see the explain plan. The temporary tables are normally created in-memory, but when they reach a certain size, they are converted to disk based temporary tables. This is an expensive operation and should be avoided by reducing temp tables needed, the join size and increasing tmp_table_size and max_heap_table_size parameters.
Master replication
For a master server, this gives a rough picture of how the slaves are performing. Slaves connected indicate how many slaves are currently connected. Slaves reading is the number of slaves that are currently receiving binlog data (not being idle, that is). If slaves are mostly reading, it means there is a bottleneck in data transmission to slaves.
Slave replication
For slave databases: Slave SQL thread load is the load percentage of the slave SQL thread, which repeats SQL statements from the master. Near 100% means a bottleneck in sql replication, e.g. due to locking or slave reaching its max capacity. Slave IO thread load indicate the load percentage of the slave IO thread, which receives remote binlog data from the server and writes it to the local relay log. Near 100% means a bottleneck in data transmission or relay log writing.
The line chart
The line chart is visible to the right. It shows time series of the selected preset, such as Threads connected. You can zoom in by selecting a segment with the mouse. If you right-click, there is a popup menu which allows printing the chart or saving it as an image. You can also zoom out, change the chart type and scroll (this can also be done from the toolbar).
Top lists
The lower half of the screen shows different top list views of the recording data. This is key information when deciding what to optimize. Fixing the right queries can often give huge improvements in performance.
Some of the top lists have filter in the upper right section. Here you can filter the query list so that only queries containing a certain string are shown, or that queries containing a certain string are excluded. The filter is applied to both query, database and user. This allows you to only show queries for a specific user or using a specific set of tables with same schema or prefix. Or you can filter by query type, such as SELECT or UPDATE. You can also enter java regular expressions, see https://docs.oracle.com/javase/7/docs/api/java/util/regex/Pattern.html for more information.
The top lists are connected to the upper line chart. If you zoom in on a time interval in the line chart, the top lists will be specific for that interval. This makes it easy to drill down on interesting time periods, such as spikes and deviations from normal load patterns. The different top lists are:
Top Queries
This is a top list of the most seen queries. Queries are aggregated by their normalized form. They are also abbreviated to make it shorter and easier to read. If you place the mouse cursor on the query, you will see the slowest performing example query in its full length (you can also copy the table contents and get the full queries that way).
To the right of the query, an explain button is shown, see Explain section below. The average thread count is displayed as a bar. The Total Time column shows the estimated, aggregated execution time for the query, excluding lock time.
Top Tables
This is a top list of the most open tables. This gives a fast view of the load situation, since you can often relate very easy to what different tables mean in your application.
Top Schemas
This is a top list of the most open schemas, which is an aggregated view of Top Tables above. For bigger applications, this can be a fast way to find bottlenecks. If schemas are isolated from each other, this can also be a good basis to scale by moving some schemas to separate hardware.
Top Users
This is a top list of the most time and thread consuming users. The time excludes lock time. For bigger applications and multi-user environments, this is a fast way to find bottlenecks. If users rights are isolated from each other (as is typically the case with shared hosting), this can be a good basis to scale by moving some users and their tables to separate hardware.
Top IPs
This is a top list of the most time and thread consuming client IPs. For multi-server environments, some machines might have dedicated workload. Typically, one web server might run cron jobs, another might serve an admin gui interface etc. The statistics here might be especially useful in case they all have the same db user.
Top States
This is a top list of the most common thread states. Especially, you should watch out for sudden changes in heaviest states. This information can also be compared with the Slow Queries top list below and the line chart States preset above. This information requires knowledge of MySQL internals, but can be rewarding once you know the different states and their meanings. See:
http://dev.mysql.com/doc/refman/5.1/en/thread-information.html
Slow Queries
This is similar to the slow query log built in to MySQL. Any query that takes more than x seconds to complete will show up here (see also Edit recording settings). Time spent waiting for MyISAM locks is excluded, since this time does not consume any server resources. The longest state column can give you a clue about why the query is slow. For example, ”Copying to tmp table on disk” will tell you that the query deals with a lot of data and needs to create temporary tables for it, e.g. because it is doing a GROUP BY. This can give you insight in how to improve the query.
Locked queries
MyISAM tables are fast, but cause locks when many threads want to read and write simultaneously to the table. This slows down throughput for the query. This top list shows the queries that are causing the most MyISAM locks. There are many ways to reduce the locking and improve the write performance, see Improving Lock problems below.
Menu options
Most menu options are also available as toolbar buttons and other buttons in the GUI. The things not mentioned elsewhere are:
Save and open
This allows you to save recorded information for later use. Some example use cases for this:
- Recurring monitoring - Make a recording every week and save them. After deploying code changes, you can go back and compare to see if performance improved or not, or if new queries show up in the top lists.
- Troubleshooting - If you managed to record during a period of bad performance (such as at 3 am when nothing works), it can be of great help to have the recording and troubleshoot the day after.
- Emailing – you can email a recording to coworkers and experts for easier sharing of information.
Save HTML Report
Select this item to save an html report of the selected time frame. The report will contain charts of all presets as well as a list of the top queries.
Delete selection
If there are parts of the recording that contain too much noise or irregularities, it can sometimes be nice to just exclude those parts from the analysis. Select the part in the line chart and choose Delete selection. The part and all its statistics will be deleted.
Language
This changes the language used in Jet Profiler. A restart will be required for the change to take effect.
Online documentation
This opens up a web browser to the online documentation at the Jet Profiler website.
Buy license online
This opens up a web browser to the Jet Profiler web site shop, where you can buy software licenses.
Enter registration key
This shows a dialog where you can enter your registration key. See license activation below.
Check for updates
The application automatically checks for software updates when you start it. You can also trig this by selecting this menu option. Software updates are downloaded and installed automatically. A good habit is to always get the latest updates, since they contain feature updates and bug fixes. By clicking on the ”More info” button, you can get details on what the update contains.
Changelog
This shows a window with the list of changes in each software update.
About Jet Profiler for MySQL
This shows an about box including license information.
Explain dialog
In the top lists that contain queries (such as the Top Queries tab), there is an explain button. Clicking this button (or right-clicking the query and choosing Explain) will open up an Explain dialog and issue an EXPLAIN SELECT command to the MySQL server. This command is built into MySQL and will show the query execution plan, such as what indices will be used, in what order the tables will be searched, and so on. For more information on EXPLAIN, see:
http://dev.mysql.com/doc/refman/5.1/en/using-explain.html
The output of the EXPLAIN command can be hard to interpret. The shown dialog will help visualize this by showing the join order of the tables and the index usage. Jet Profiler will also create a rating of the query, so you can easily separate bad queries from good ones. The rating is based on the following:
- Join size – The join size is calculated as the maximum number of rows that might get examined by a query. It is the product of explain rows per table. It is a rough measure of how slow and resource intensive a query can be, worst case. The slow rating goes up by 1 for every factor 10 of join size (so a join size of 70 will be slow rating 2, and a join size of 700 will be slow rating 3).
- Full table scans – If the query doesn't use any index at all, it will do a full table scan. This is the worst form of query, especially on large queries, since it will cost a lot of I/O to read the table.
- Full index scans – Not as bad as full table scans, but still bad.
- Using temporary – Queries doing a lot of GROUP BY use temporary tables which are resource intensive. Temporary tables are created in memory, but converted to disk if they are too big. This is an expensive operation. Temporary tables are also used when an ORDER BY uses multiple columns from separate tables. See below.
- Using filesort – Caused by doing ORDER BY on unindexed columns. This means an additional sorting step is required since the data is initially unordered. The name filesort is misleading though, as the sort is normally done in memory. You can try to rewrite the query into getting a natural order, or by adding an index on the order by columns. For detailed information on ORDER BY execution, see http://dev.mysql.com/doc/refman/5.1/en/order-by-optimization.html and http://s.petrunia.net/blog/?p=24.
You can edit the query in the text area and rerun the explain to see what gives you the best performance. You can explain some UPDATE and DELETE statements too. Jet Profiler will try to rewrite the UPDATE / DELETE into a SELECT statement before running the EXPLAIN. Example:
UPDATE table SET a = 123, b = NOW() WHERE c > 456
will be rewritten into the following SELECT statement:
SELECT * FROM table WHERE c > 456
This is roughly equivalent in terms of what indices will be used, and the overall performance of the query. You will still have to consider differences between DELETEs, UPDATEs and REPLACE INTOs in terms of table writes, table reads and fragmentation.
If a query contains subqueries, MySQL will need to execute those subqueries when doing an EXPLAIN. This can cause load on the database. If the subqueries contain stored procedure calls, it can also cause unwanted writing to the database. Therefore, Jet Profiler will warn you if you try to explain something that contains subqueries.
Please note also that the output of the EXPLAIN command will show the current execution plan, which is not necessarily the same as when the query was originally run. For instance, a slow DELETE statement might have deleted all its rows, so when you EXPLAIN it, it seems fast because no rows are left to find.
To better understand how EXPLAIN works, how the MySQL optimizer works and how joins are executed, see:
https://web.archive.org/web/20100615201621/http://maatkit.org/presentations/katchaounov_timour.pdf
As a final note, the EXPLAIN command provides many clues on the query execution plan, but it has some limitations. It doesn't properly take into account a LIMIT clause, so a query containing LIMIT might show a bigger join size than the actual join size. Jet Profiler for MySQL will display a question mark in the rating to indicate this. Furthermore, the join size can be off by factor 10 or more in some situations. For a detailed discussion on the limitations of EXPLAIN, see http://www.mysqlperformanceblog.com/2006/07/24/mysql-explain-limits-and-errors/. To summarize, the EXPLAIN output should be treated as an estimate and not as the real query execution cost.
4. Registering your software license
Jet Profiler for MySQL comes in two versions, the free version and the professional version. You can read more about the feature differences on our website: http://www.jetprofiler.com/buy/. The professional version requires a registration key which you will receive with the purchase on the website.
Normal registration
When you start the application, you will be prompted to enter the registration key. You can also use the Help menu to do this. The registration is as follows:
- Enter the registration key in the box.
- Click OK.
- The application will contact a license server online to bind the registration key to your computer and enable the license.
- If successful, you will be prompted to restart Jet Profiler.
- When starting it, you should see ”Professional version” and some license information in the splash screen (or in the About box in the Help menu).
Manual / offline registration
The registration process above requires internet access. If you do not have internet access, for instance if you are on a secure LAN, you can do a manual registration.
- Enter the registration key in the box.
- Click OK.
- The application will tell you it couldn't contact the license server.
- Click Manual registration.
- Copy the text (Manual Registration Code Block) and email it to support [at] jetprofiler.com (from another computer with internet access).
- We will send the license data back to you.
- Paste the license data in the box.
- Click Finish.
- If successful, you will be prompted to restart Jet Profiler.
- When starting it, you should see ”Professional version” and some license information in the splash screen (or in the About box in the Help menu).
5. Recording
First, you should edit the connection settings to make sure you can connect properly to MySQL (see Edit Connection Settings above). Then, you should edit the recording settings according to the database you will be profiling (see Edit Recording Settings above).
The next step is to start recording by pressing the record button. You should start to see information coming in in the linechart. In the status bar at the bottom of the screen, you can also verify the recording progress. It should say ”Status: recording” and the recorded time.
To stop recording, press the stop button. Again, the progress is visible in the status bar at the bottom of the screen. Once stopped, it should say ”Status: idle”.
Follow mode
If you keep the line chart to the far right of the recording (or if you have zoomed out fully), it will automatically update as more data is recorded. As soon as you zoom in on something that isn't to the far right, the follow mode will stop.
How long to record
Start with 1 second polling interval. On a busy system, you should get relevant results within a minute or two, but you might have to run it for 30 minutes or more depending on the load and the polling interval.
If nothing shows up
If you do not get any results, chances are your database is not doing much work at all. You can try using a shorter polling interval (100ms) and running for longer periods of time. If you still do not see anything, you can always issue a long running query manually (e.g. Using the mysql prompt):
SELECT SLEEP(30);
It will run for 30 seconds, and should show up in the profiling. If you are using MySQL < 5.0.12, you can run
SELECT BENCHMARK(50000000, ENCODE('hello','goodbye'));
but it takes some CPU to run.
Interpreting the results
One good place to start is with the Threads preset. This will give you a quick overview of the general load situation. If you have close to zero Threads running, the database is mostly idle. If you have closer to one or above, your system is busy. By switching to the users preset, you can determine which users are causing the most load.
Next, you should look at the Top Queries top list. Here you will see the busiest queries, i.e. what you can optimize in order to improve performance. These queries generally fall into two categories:
- Heavy queries - queries that consume a lot of resources to execute. This is probably because the query doesn't utilize indices properly, or because the tables are inefficient.
- Frequent queries - queries that are fast to execute, but runs very, very often. This can be legitimate, or it can be the result of a for-loop in the code which could be rewritten into a join query.
If you explain the queries, you can get more information about if a query is performing badly. The rating will tell you if it has a big join size or other bad "smells" such as full table scans.
From here, you should be able to trace the query back to your application and find the causing use case.
Spikes
Often, you can see sudden spikes in load. For instance number of Threads running suddenly rising during a short time period. Some examples of how spikes might occur is if a database intensive web page suddenly gets loaded in your web application, or if a cron job starts and does some heavy querying.
To learn more about what is causing the spike, zoom in on it and check the Users preset and the Top queries tab. You can also check the Slow Queries tab to see if there is anything there. By scrolling in and out of the spike, you can compare the load patterns and see what is most likely causing the spike.
Multiple Instances (Enterprise version)
The enterprise version allows for recording from multiple database instances simultaneously. To do this, just start Jet Profiler multiple times, using a different connection bookmark in each instance.
6. Profiling replication
MySQL replication is single threaded. This can cause a performance bottleneck, since master writes are parallel, whereas slave writes become serial. Due to this, a master-slave pair with same hardware specs will typically show slave replication lag problems before the master becomes overloaded. Therefore, you might want to profile the replication regularly to see how loaded the replication write thread (called the SQL thread) is.
The Slave preset button will show you how loaded the SQL thread is. The value is presented from 0 to 1 where 1 is 100% load. Everytime it stays at 1, replication might start to lag. By taking the average of this figure during a busy period, you get a rough measure of how much more load you can take before replication will start to lag. An average of 0.8 will mean you can take 25% more load. You should always allow for some headroom in case of spikes.
Since replication is single threaded, it is important to avoid slow queries and locks in the slave SQL thread. In MyISAM installations, replication lag can occur when a slow query runs against a MyISAM table on the slave at the same time as a write query is replicated to the slave. The replication thread will need to wait for the table lock, and the lag will increase. Therefore, you should check the Locked tables top list to see if there is anything you can do there. Locked queries by the user ”System User” are writes sent over replication that are lock prone. Locked queries by other users are queries issued against the slave which are competing with each other, and probably the replication thread. Thus, both categories can be important to optimize.
Improving MyISAM Lock problems
There are many ways to reduce MyISAM lock problems. For instance:
- Convert the table type to InnoDB. It will take more disk space, but concurrency will be better. For a detailed discussion, see: http://www.mysqlperformanceblog.com/2006/06/17/using-myisam-in-production/
- Rewrite slow updates to only use indexes, e.g. by introducing temporary tables. First do a select into temp table, which is slow. Then run the update based on the temp table.
- Create batched inserts instead of single inserts.
- Create batched updates instead of single updates.
- Reduce selects by introducing caching, such as memcached
- Split the table in write-often data and read-often data.
- Split a long query in smaller batches, eg using Muuttaa: http://code.google.com/p/digg/wiki/Muuttaa
7. Command line options
Recovery
Jet Profiler will automatically recover any unsaved work during startup. Most often, this is what you want. You can disable this behavior by adding the command line option
jetprofiler --skip-recovery
Scheduling (Enterprise version only)
You can automate recording by running Jet Profiler as a scheduled job. Example:
./jetprofiler record <bookmark> --duration <secs> --outfile scheduled.jpp
Make sure to cd to the folder where jetprofiler (or jetprofiler.exe) is located, Mac OS X example:
cd /Applications/Jet Profiler 4.app/Contents/MacOS
./JavaApplicationStub record <bookmark> --duration <secs> --outfile scheduled.jpp
Jet Profiler will start up, connect to the bookmark and record for the specified duration. After that, it will save both the recorded data and an html report. Please note that at this time, you still need a graphics environment for this to work.
8. Miscellaneous
Excluding queries from profiling
By default, Jet Profiler will include all queries it sees on the server. However, sometimes you might want to exclude one or more queries from profiling. For example, it might be a query which you've already optimized as much as you can, and you'd now like to remove it from future reports. To exclude queries, you need to prefix them with a comment:
/*jp-ignore*/ SELECT ... FROM table WHERE ...
Make sure you type the comment exactly as above, without whitespaces and at the beginning of the query string. Also make sure that your MySQL client library does not remove comments before sending the query to the server. The MySQL command line tool does this by default unless you start it with the option --comments.
Note that this only affects query-specific statistics - Top Queries, Top States, Slow Queries and Locked Queries. It does not exclude the query from general statistics such as InnoDB I/O, Threads running, Questions per second etc.
9. Further reading
For more information on MySQL and performance tuning:
- http://dev.mysql.com/doc/refman/5.7/en/ - MySQL 5.7 reference manual
- https://planet.mysql.com - Planet MySQL (blog aggregate)
- http://www.percona.com - Percona (performance consulting experts)
- https://www.percona.com/blog/tag/mysql/ - Percona MySQL blogs

“With Jet Profiler we were able to find improvements for our reporting system within minutes of starting up the tool.”
AdAction Our customers »