Jet Profiler Tour
Jet Profiler is a great tool to pinpoint performance problems in MySQL databases.
Screenshots
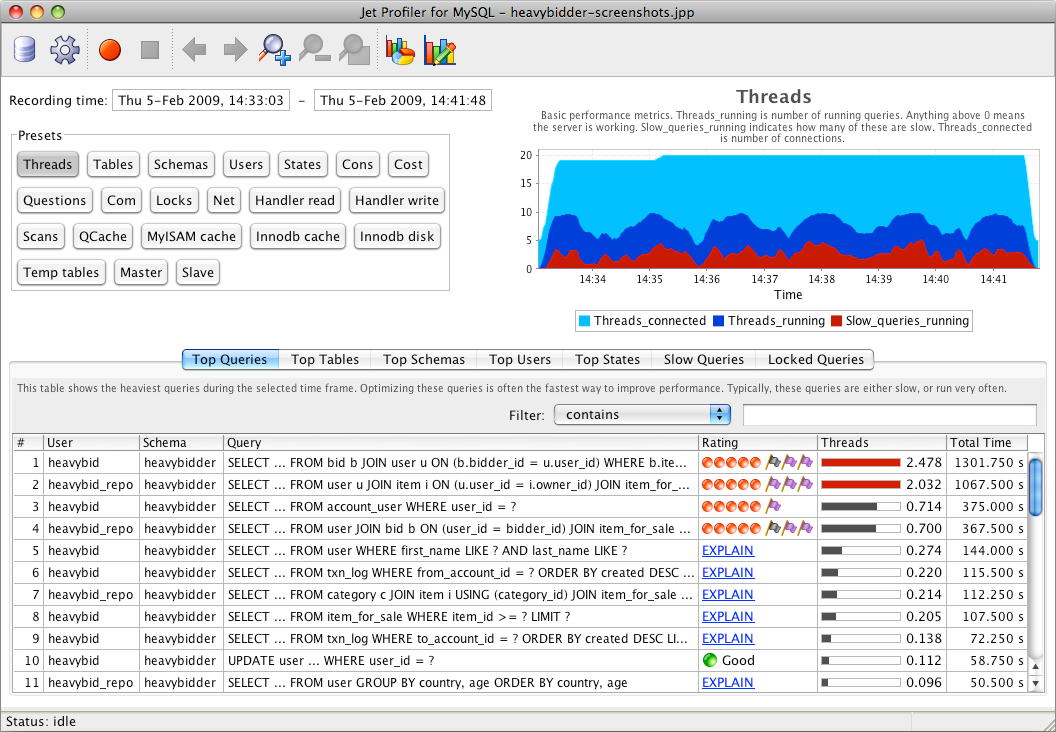
Top Queries
The screenshot shows a sequence of 8 minutes of test load, with peaks every 90 seconds. The upper line chart diagram shows Threads, number of total connected threads in light blue and number of running threads (executing queries) in dark blue. The red area indicates how many slow queries are running. The Top Queries table shows which queries are most frequently observed along with a rating based on EXPLAIN. This view is the most important tool to find the worst performing queries.
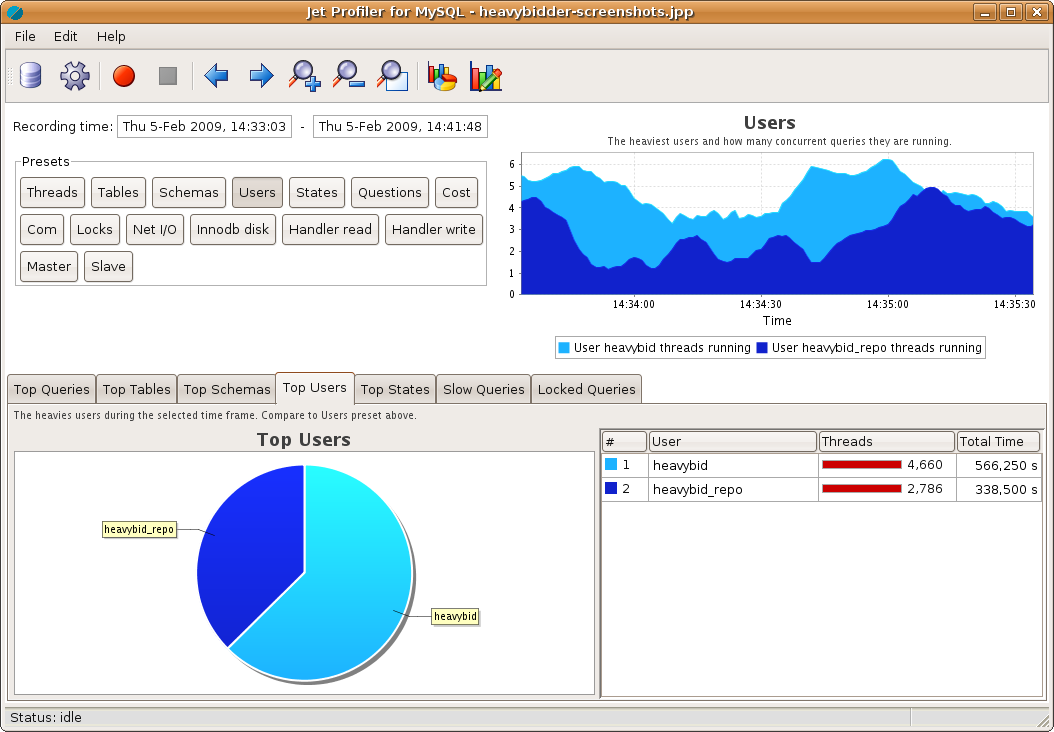
Top Users
This screenshot shows a comparison of the different users. Both the line chart and pie chart diagrams indicate that the heavybid user is the most frequent user. If running in a multi-user environment, this can be a quick way to determine if a particular user is overrepresented.
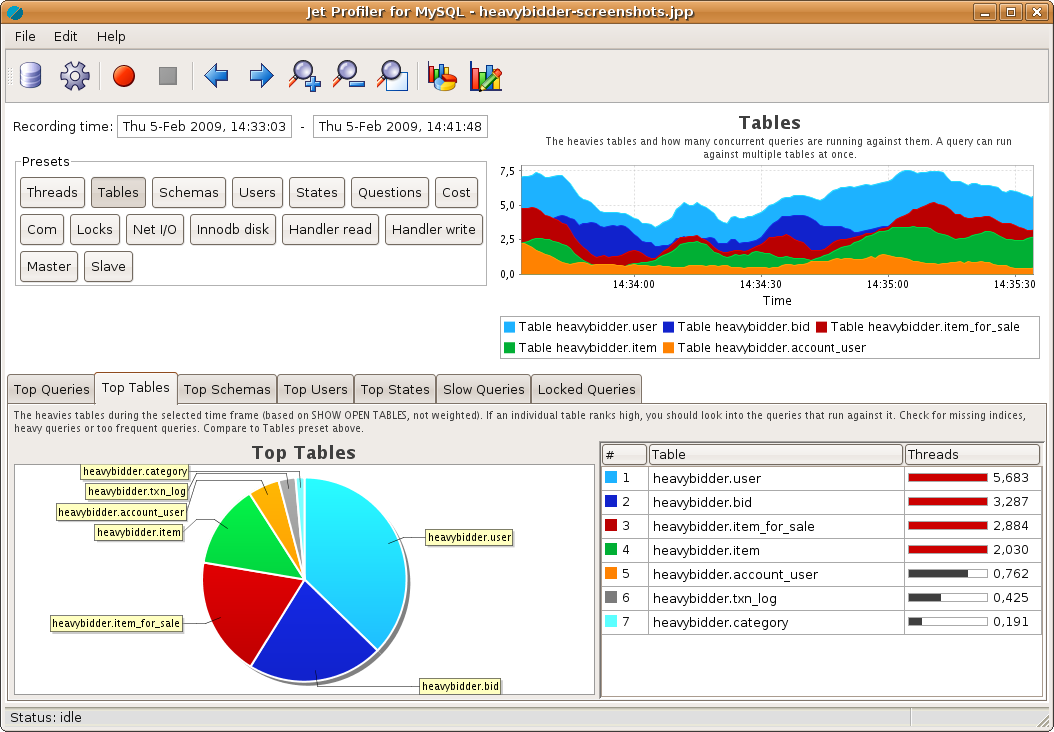
Top Tables
This view, Top Tables, shows what tables are used most frequently. The table heavybidder.user from our test application causes about 40% of the load. Sometimes, this can be the best way to determine which parts of the database are worst performing - tables lacking proper indices.
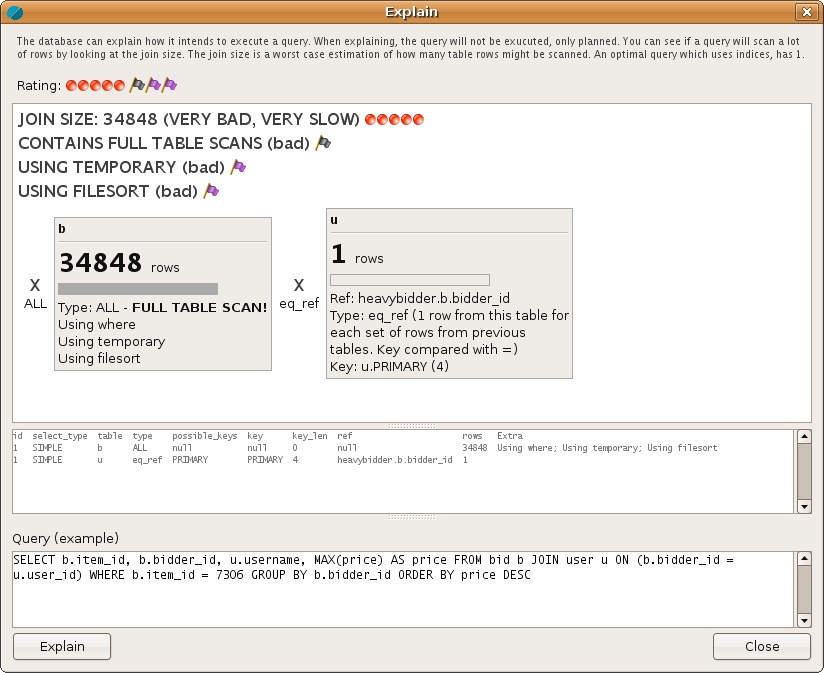
Query ratings
The Explain Dialog shows a visualization of the query execution plan. A query rating shows if the query is well written and uses indices correctly. You can edit the query and rerun the EXPLAIN command to see if you can improve it.
Features
-
Top Queries - See which queries are being run the most on your server.
-
Top Users - See which users are using your server the most.
-
Top Tables - See which database tables are opened the most.
-
Top States - See which states your database is most busy doing, such as creating temp tables.
-
Top IPs - See which client IPs are using your server the most.
-
Replication Profiling - You can measure how much capacity you have left on the replication SQL thread on slaves. If you are using MyISAM a lot, a lock analysis will help discover any locks associated with replication.
-
Master and Slave statistics - See how many threads are working on your masters and slaves. Find I/O or SQL bottlenecks.
-
MyISAM Lock Analysis - You can view which queries cause the most amount of MyISAM locking. This can be used to minimize replication lag and lock contention on busy tables.
-
Query Ratings - You can get your queries rated and see which queries are most likely to cause load due to missing indices, big tables and more.
-
Query Visualization - The query execution plan can be visualized using EXPLAIN. A diagram shows the table lookups involved, the rating and join size.
-
Slow Queries - See the slowest queries per time interval.
-
Zoomable GUI - You can easily zoom in on spikes in your load and see the corresponding queries for that time interval.
-
General Server Metrics - Such as threads connected, network I/O, command statistics, handler statistics and more. 50+ metrics are recorded from the server.
-
Save / Load Support - Save profiling data for later use, compare week to week or normal load vs high load situations.
-
HTML reports - Generate html reports for later viewing.
-
SSH Tunneling - Connect to remote databases using SSH tunneling.
-
Command line scheduling - Automate repeated recording.
-
Multiple instances - Monitor multiple MySQL instances simultaneously.
-
Low Overhead - Running the tool against your database typically costs around 1%. Recording granularity customizable.
-
Supports all MySQL Versions - Works on 3.x (!), 4.0, 4.1, 5.0, 5.1 and 6.0, Enterprise and Community editions.
-
Works on Windows, Mac and Linux
-
No Server Changes
-
Simple Setup
-
Free / Professional / Enterprise Version - The free version doesn't cost anything and isn't time limited. Upgrade to the professional or enterprise version to get all features.
-
Multi-language support - available in English, German, French, Japanese and Swedish.