Best way to visualize EXPLAIN?
- Full table scans
- High join size product
- Using filesorts
- Using temporary tables
This can be hard to see in the raw output. Example query:
EXPLAIN SELECT b.item_id, b.bidder_id, u.username, MAX(price) AS price FROM bid b JOIN user u ON (b.bidder_id = u.user_id) WHERE b.item_id = '1' GROUP BY b.bidder_id ORDER BY price DESC
The explain outputs:
id, select_type, table, type, possible_keys, key, key_len, ref, rows, Extra
1, SIMPLE, b, ALL, null, null, 0, null, 22660, Using where; Using temporary; Using filesort
1, SIMPLE, u, eq_ref, PRIMARY, PRIMARY, 4, heavybidder.b.bidder_id, 1,
We've been experimenting how to visualize the output of the EXPLAIN command. Using boxes for tables, calculating the join size product and highlighting important information. What do you think of the result so far?
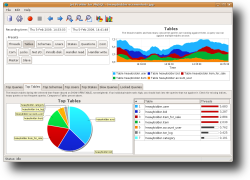
Screenshot: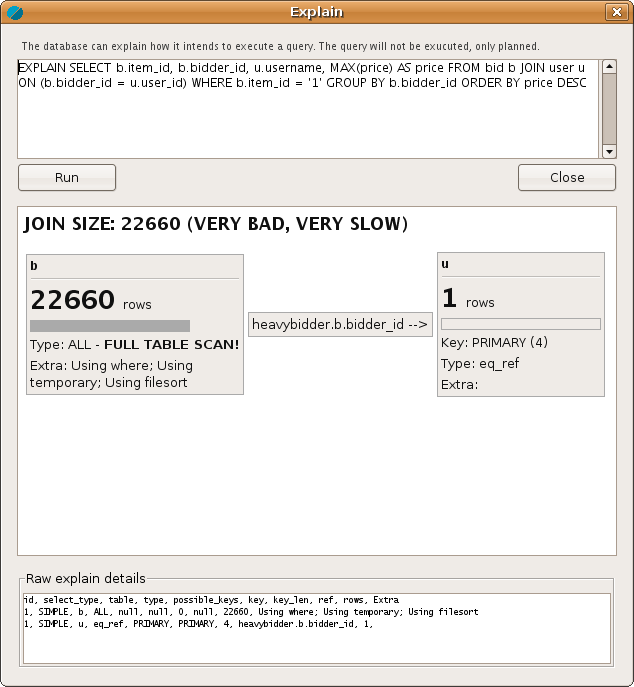
Ideas, comments?